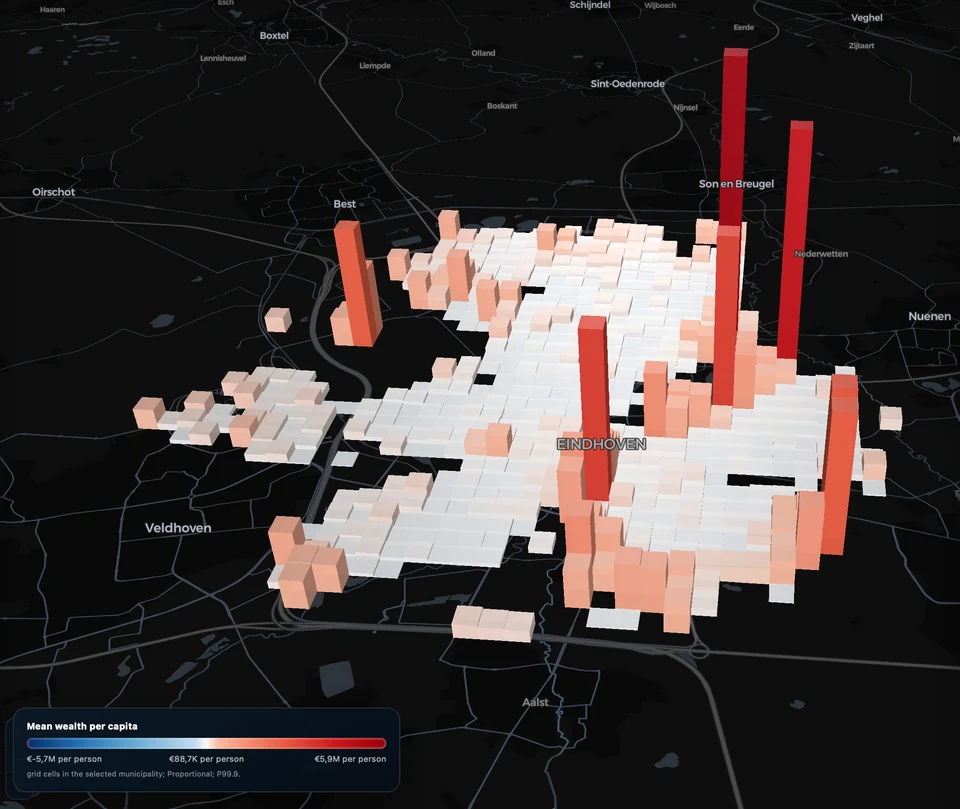
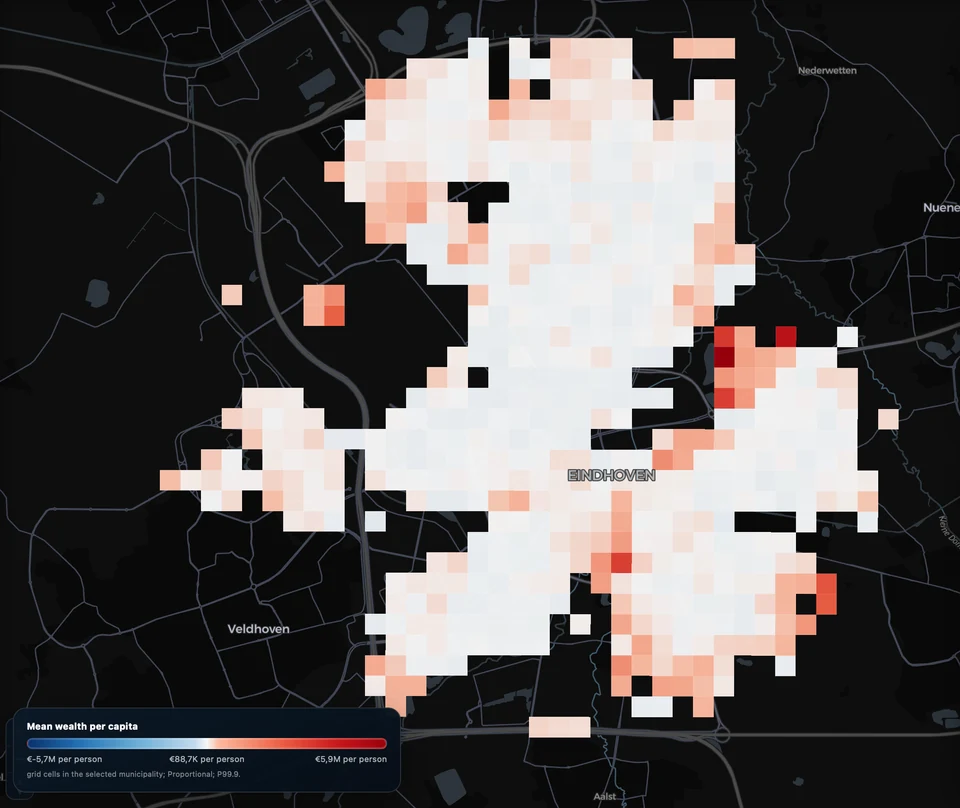
Inequality in 3D
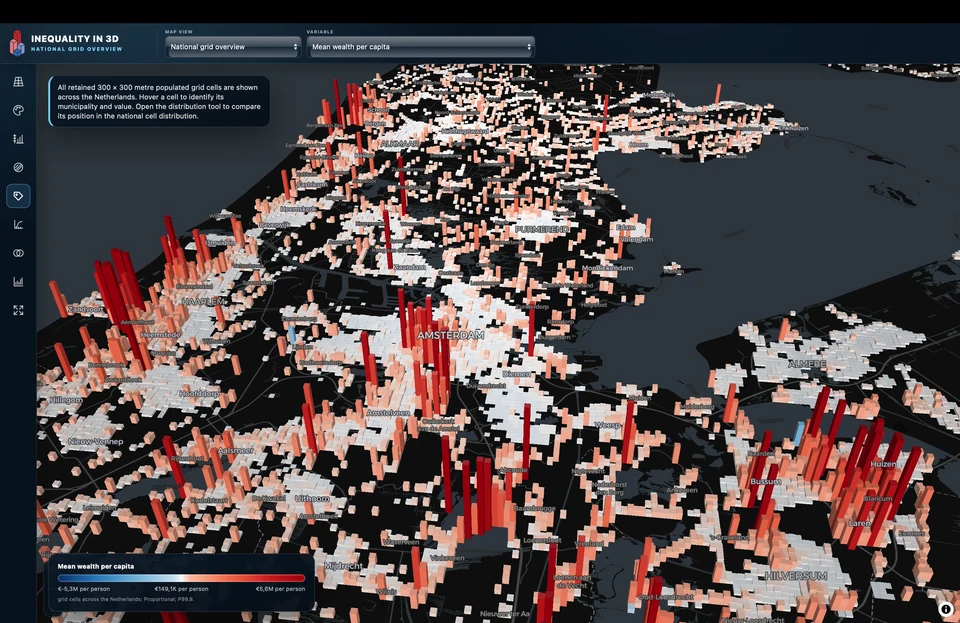
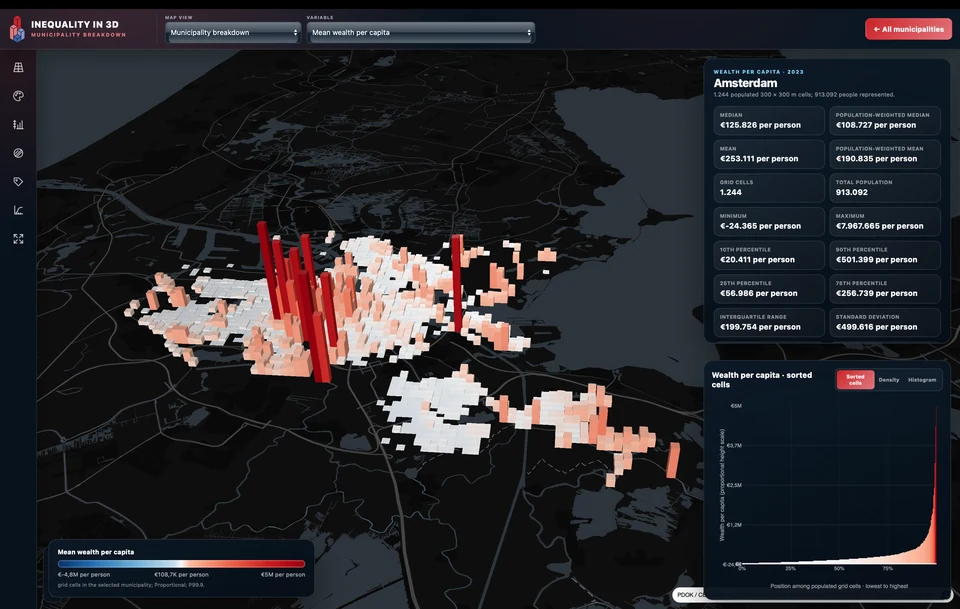
This project examines the spatial distribution of income and wealth
in the Netherlands using pseudonymised individual-level register data
for residents recorded in 2023. The analytical dataset combines
multiple sources made available by
Statistics Netherlands (CBS).
Spatial coverage
Residential contexts are represented by 300 × 300 metre grid cells.
The displayed values are aggregated spatial measures; the maps do
not contain information that identifies individual residents.
To protect privacy, every cell containing fewer than ten residents is excluded. The retained cells represent approximately 98% of the population, or 17,459,358 residents.
This privacy filter should be considered when interpreting the
results. Excluding sparsely populated cells may underestimate inequality as affluent households are concentrated in low-density locations.
Definitions
Wealth
Total household assets, including financial and non-financial
assets such as savings, real estate and other possessions, minus
household debts.
Income
Annual disposable household income after taxes and mandatory
transfers, including payments such as alimony.
Both measures are expressed per resident using the full population
living in each retained cell, including children and adults. All
measures refer to the full 2023 calendar year.